Building Planograms
This is an overview on how to build, optimize, and share a new planogram from scratch.
Alternatively, you could folder_open Open an already saved Plan, or vertical_align_bottom Import a local PSA file to use as a starting point.
Items in the canvas can be selected and dragged with the left mouse button. Clicking and dragging the right mouse button pans the canvas.
Making a Fixture
GoPlanogram fixtures are can be customized extensively, to represent nearly any kind of retail equipment.
You can explore each main fixture type below:
Racks
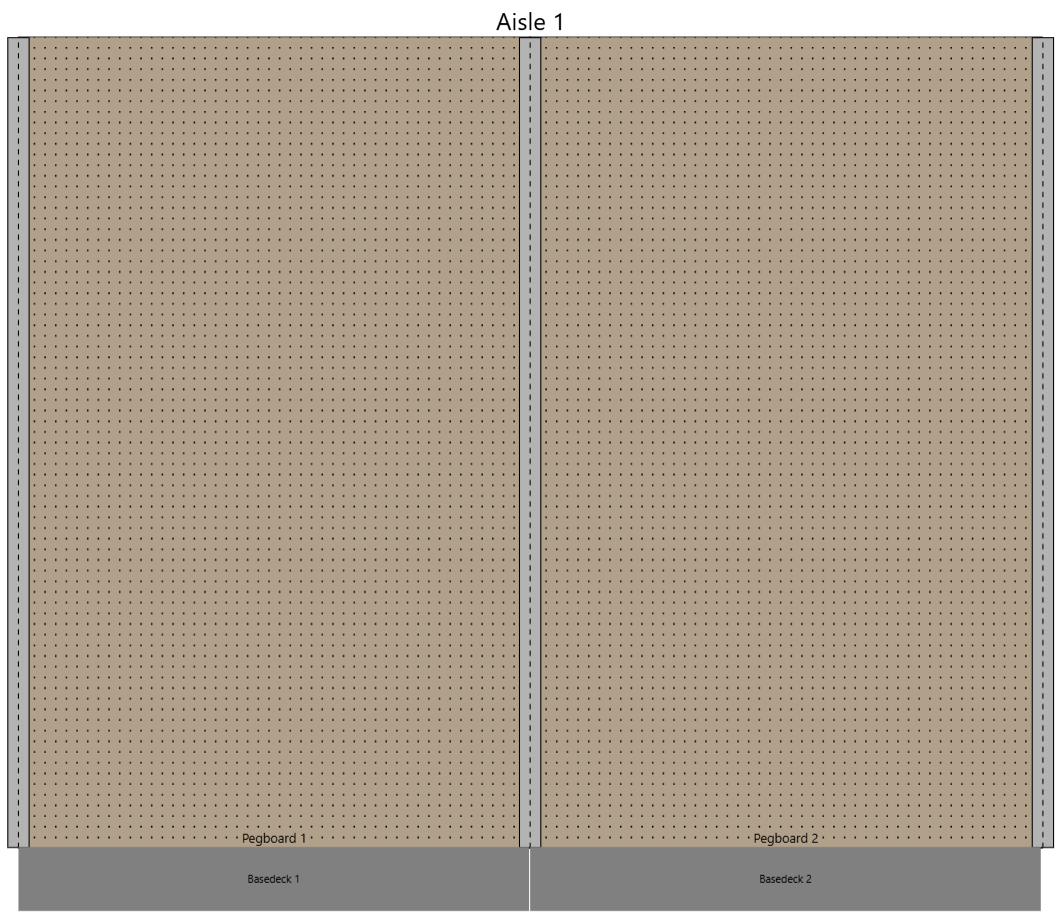
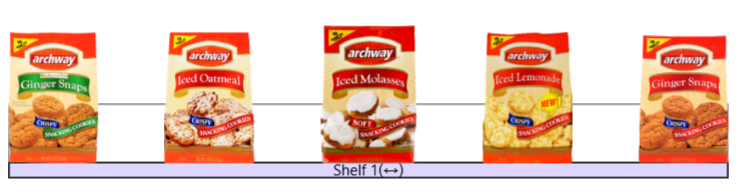
Shelves
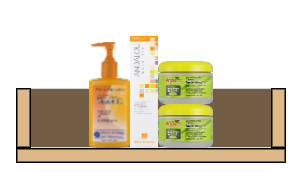
Surfaces
Containers
Hanging Bars
Creating a fixture can be done with one of these methods:
- Right-click the canvas and choose a fixture from the add_box Insert menu
- Select a fixture from the top bar add_boxInsert menu
- Drag a fixture from the Components Catalog (if your team has created any)
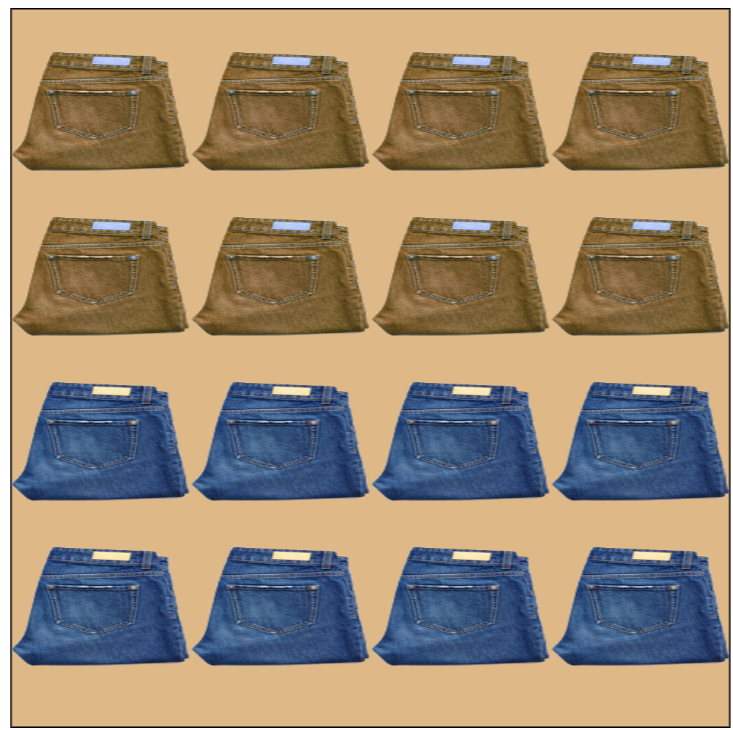
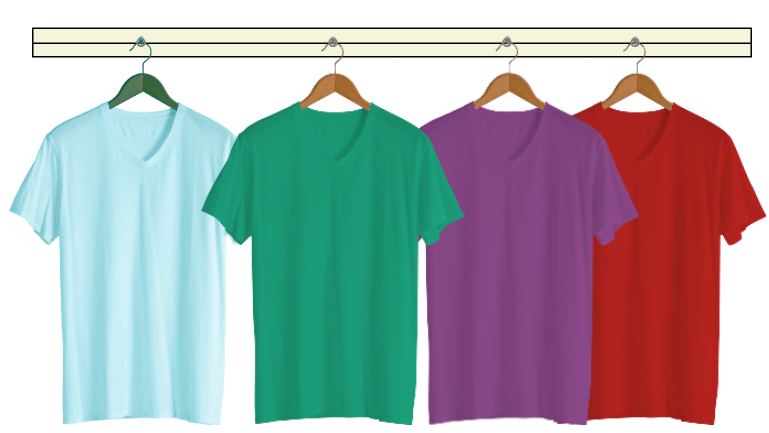
Bringing in Products
Products can be dragged into a planogram from the receipt_long Catalog. A single product, a selection of several products, or even entire categories can be dragged out.
Once in your display, a product is known as a widgets Position, which may have one or more facings.
Positions may be dragged, copied, cut, grouped, or deleted. They can be dragged one at a time, or you can drag a selection of many. To do so, click and hold the left mouse button, then drag the purple box around what you want selected.
A more automated, advanced way to populate fixtures with products is to use rules-based assignment Templates.
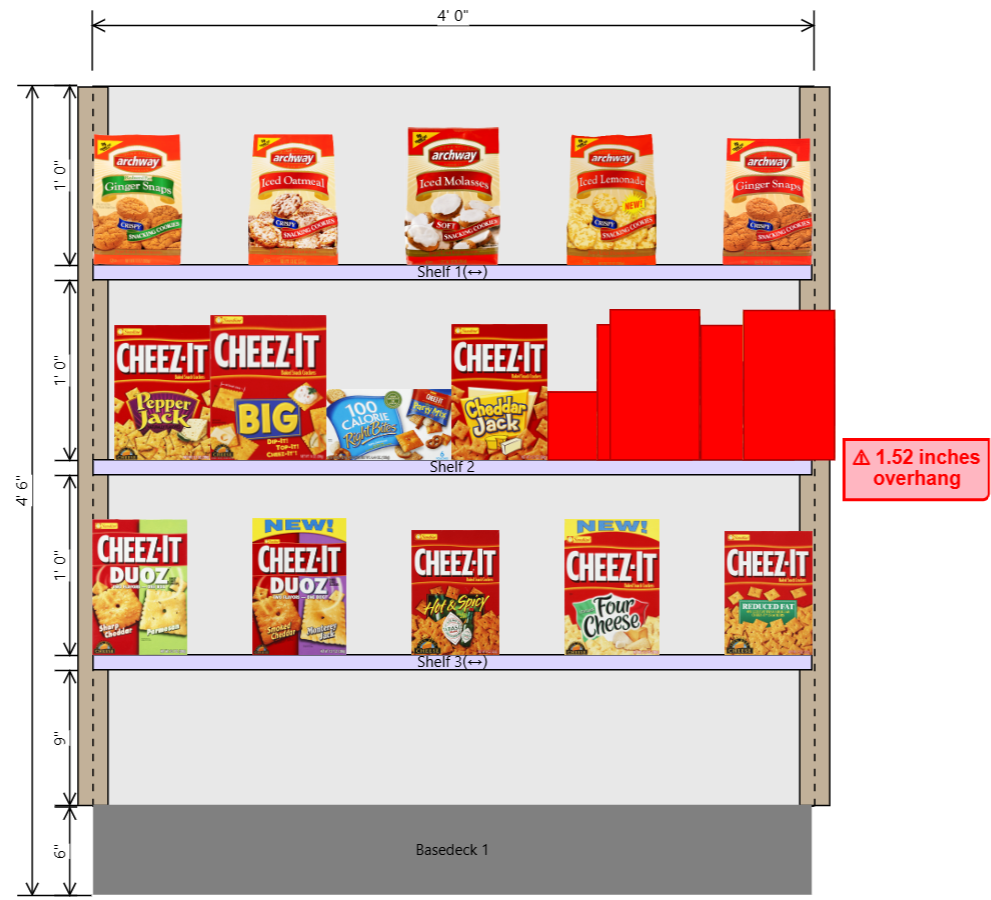
Optimizing a Planogram
Once you have fixtures with products in them, you can fine-tune and optimize your planogram with various tools.
An overview on these tools can be found here. Popular options include:
Error Checking Views
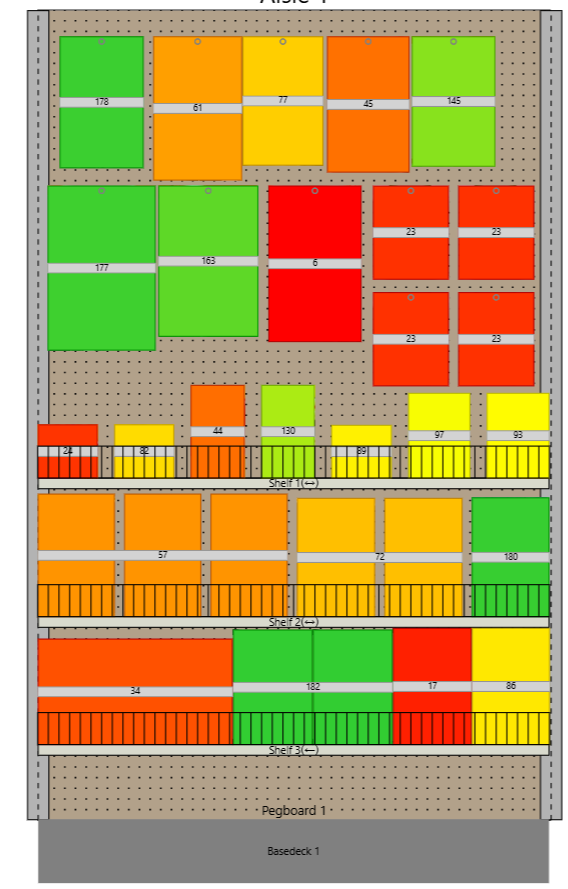
Heatmaps
Breakdowns
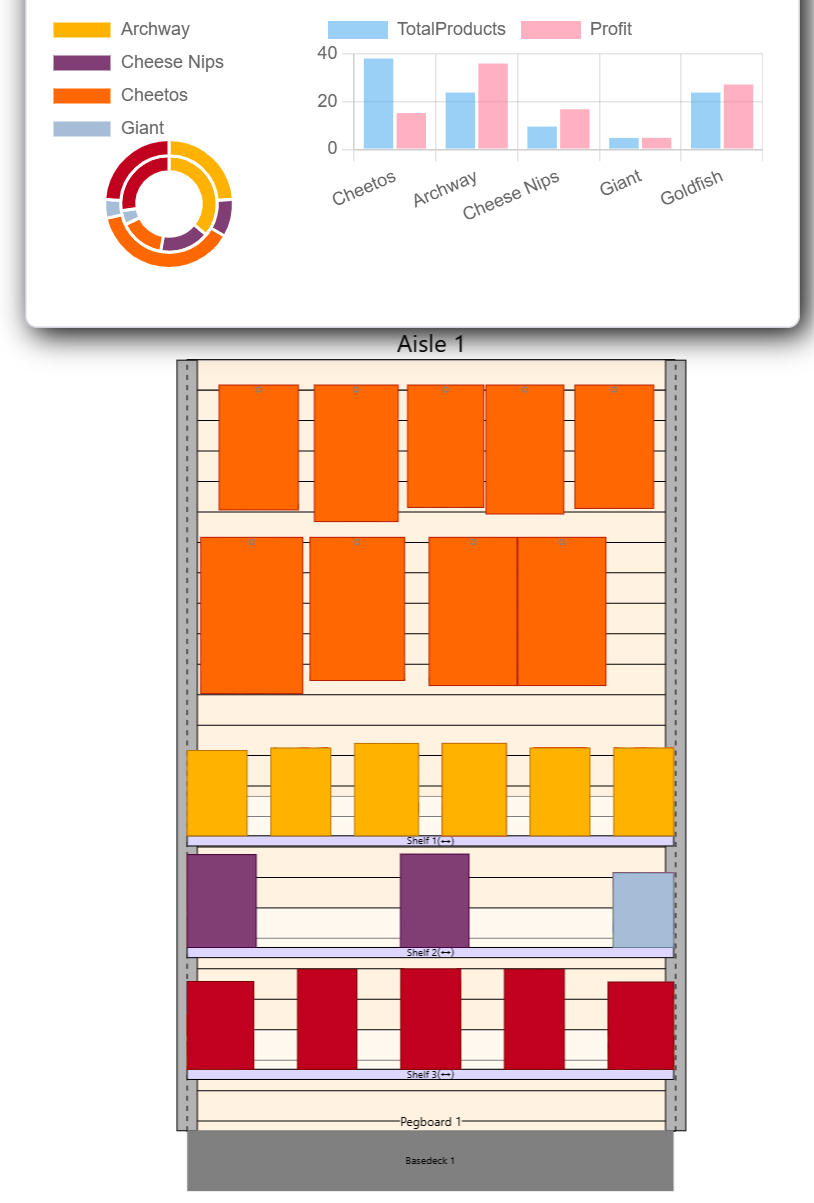
Insights
Creating a Report
First, it's a good idea to save your planogram, so you can come back to it later. Learn more about saving Plans, organizing them, and sharing them in-app here.
Once you have a planogram ready, there are many formats you can export to, so you can share the Plan with others outside of GoPlanogram.
These formats include:
- PDF - Includes images and report data. Most popular format.
- Excel / CSV - Great for further computation / analysis
- Images - Simple and easy
- PSA - Excellent for interoperability with other software
Additionally, a report may be included, which can contain any data or calculations you require. Learn more about configuring report content here.